Split test reports
To access a split test report, choose Reports > Split Tests from the left-hand navigation.
A table with all current (In progress) and Finished split tests will appear:
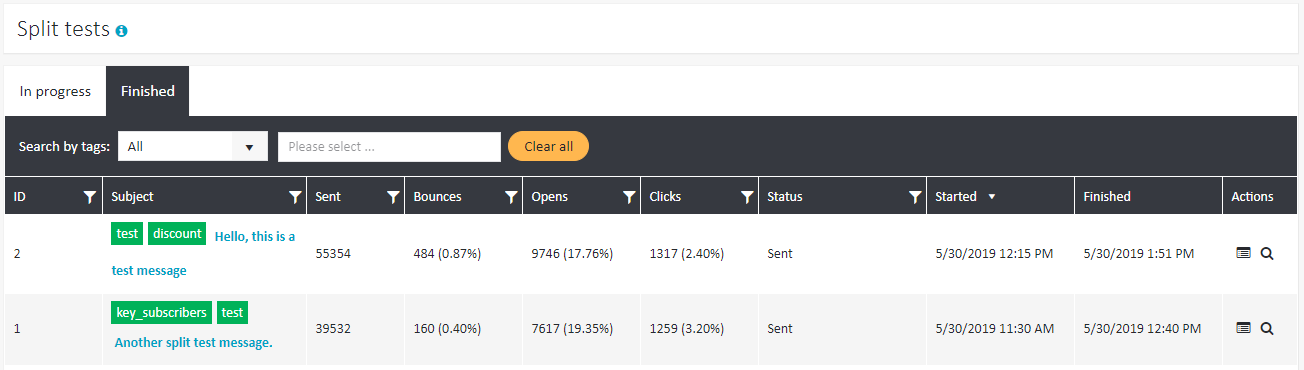
The view offers basic information and statistics on the test, like the number of sent messages, opens, clicks and the time at which the test started and finished. To access more detailed information about the test, including statistics on specific split test variants, click on the subject of the desired message. The following view will appear:
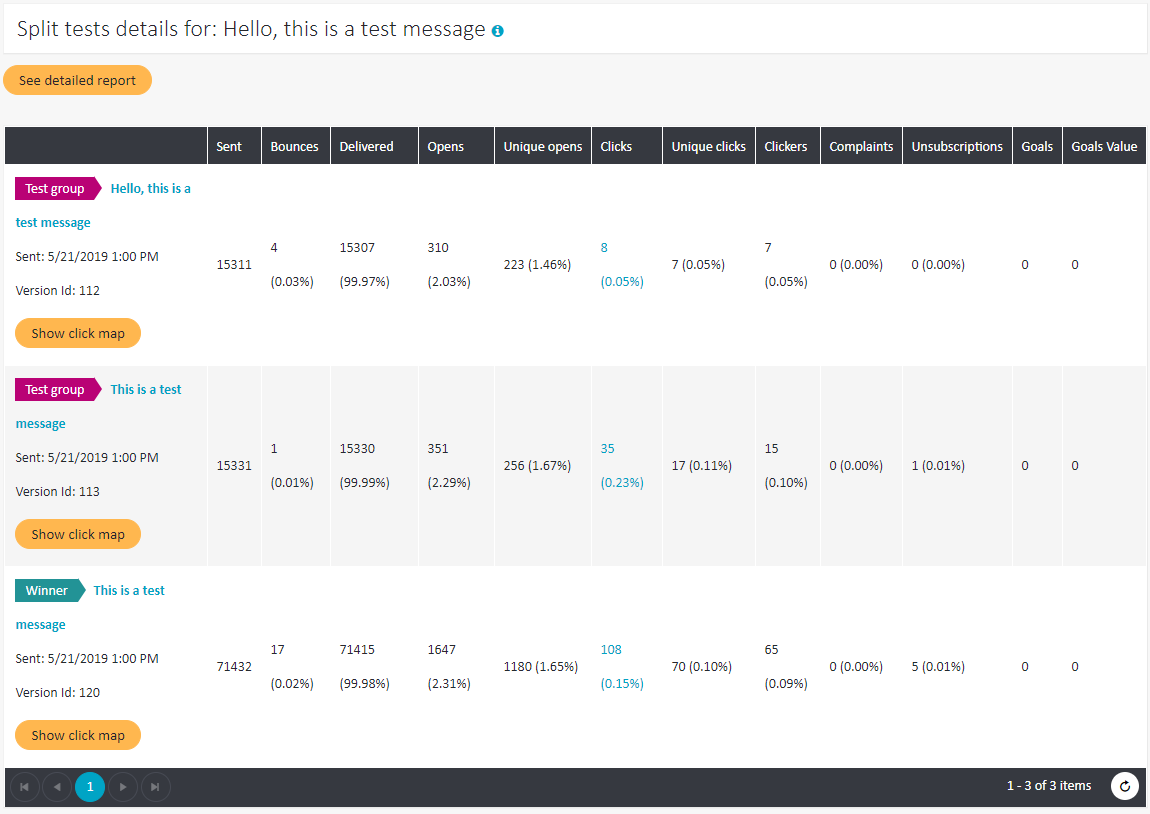
The header always contains the subject of the analyzed split test message (1). The report contains the following data (2), divided between all test variants and the winner variant:
- Sent – delivered + bounces
- Bounces
- Delivered
- Opens
- Unique opens
- Clicks – all clicks, including several clicks by one subscriber
- Unique clicks – number of first clicks on any link by any subscriber
- Clickers – number of unique subscribers who clicked on any link in any message
- Complaints – clicks on the Spam button
- Unsubscriptions
- Goals – the number of times the landing page was reached
- Goals value – the values with which the landing page was achieved
Opens vs. Unique opens#
If one subscriber opens the same email three times, it will appear in the statistics as three opens and one unique open.
Clicks vs. Unique clicks vs. Clickers#
If a user clicks five times on each of two given links, ten clicks will be counted, two unique clicks and one clicker.
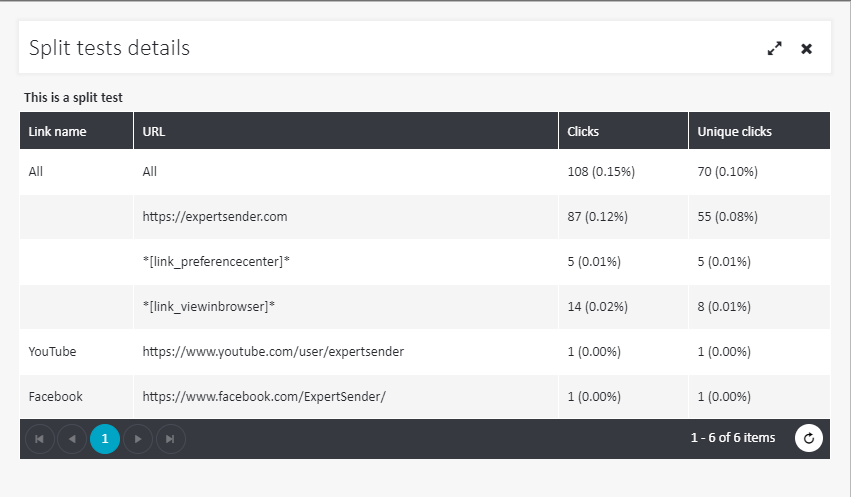
Note that, unlike in an Email summary report, you may click on the value under Clicks (see (3) above) to receive more detailed information on clicks in the message:
Statistical significance of the split test results#
After you scroll down, you will see a section entitled Statistical significance result:
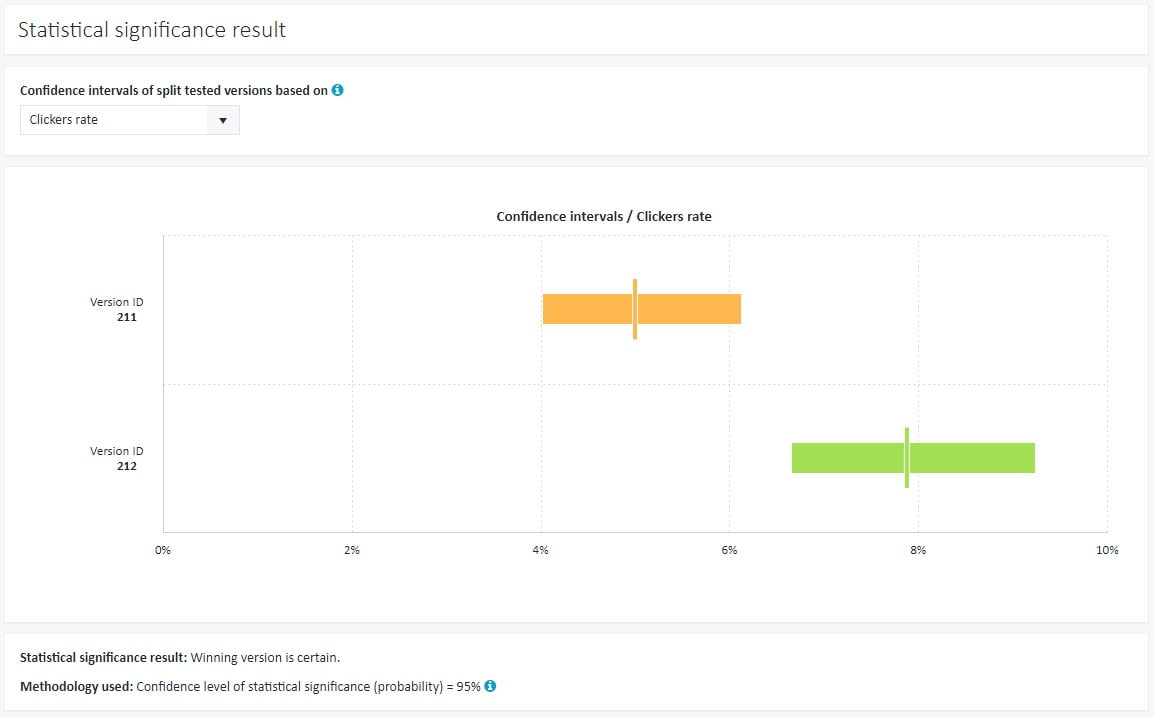
The section displays confidence intervals, i.e. values which are used to visualize the level of certainty that a test group score is statistically significant. It provides a range of values which is likely to contain the right score for each group. If the interval of the winning version does not overlap with another interval, then the split test result can be treated as certain.
In the following case the winning version is not certain, since the two bars overlap:
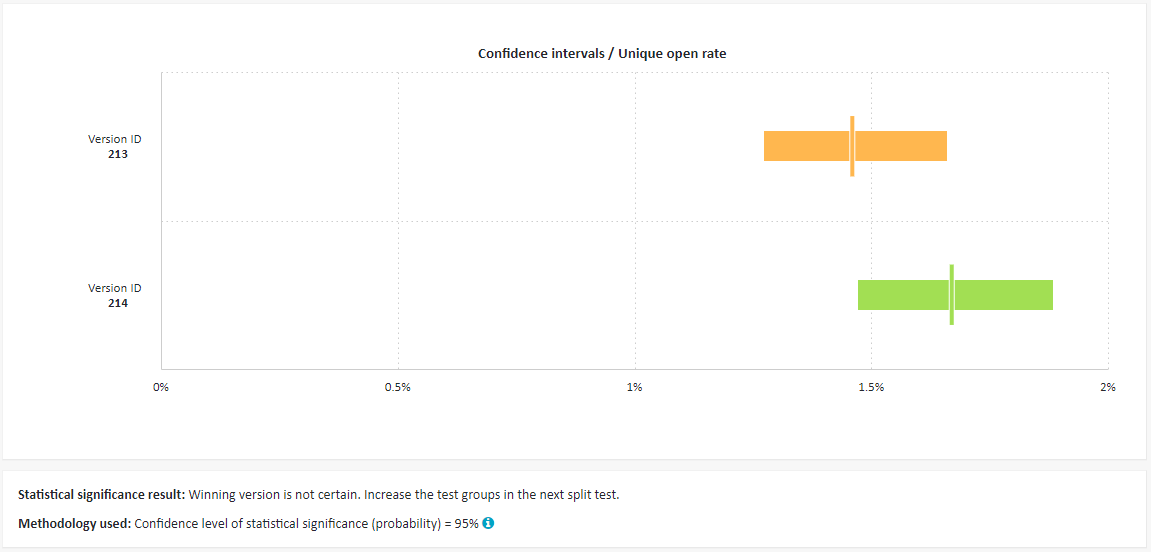
It means that the test groups should be larger during the next split test.
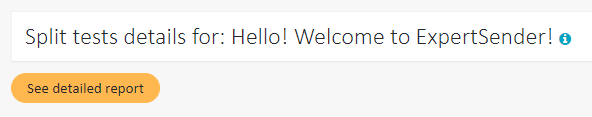
It is also possible to view an even more detailed report on a split test. For this purpose, click the See detailed report button at the top of the page:
The window in the detailed report contains the same columns as the previous view, but it also possible to analyze data by filtering and grouping them by variables like date, list, domain family, etc. (for more details on the available options, consult the Reports – Introduction article). Furthermore, you may view statistics charts for each message, details on the email clients in which the message was opened and click maps (for an in-depth description of these tools, see Email message reports).