Email message reports
ExpertSender allows you to access detailed statistics on each single message you have sent from the platform.
How to access an email message report?#
A report on a specific email message can be opened in two ways:
- Through the Reports section
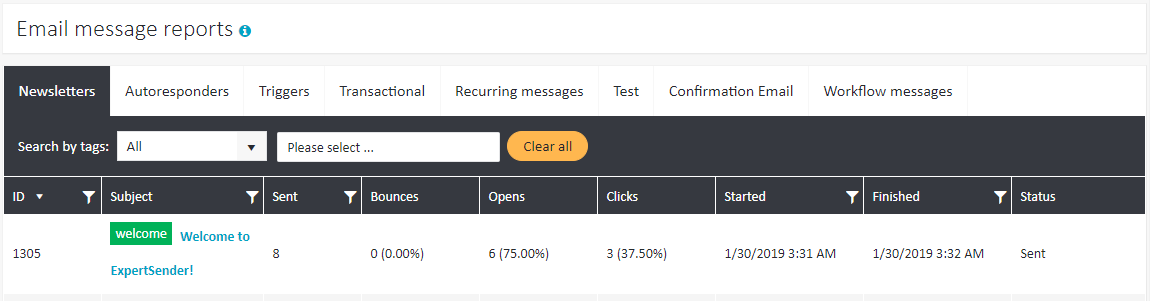
- Select Reports > Email messages from the left-hand navigation. A table with all of the email messages you have sent will be displayed.
- Select the tab with the desired message type and click on the subject of the chosen message.

- Through the Email Messages interface:
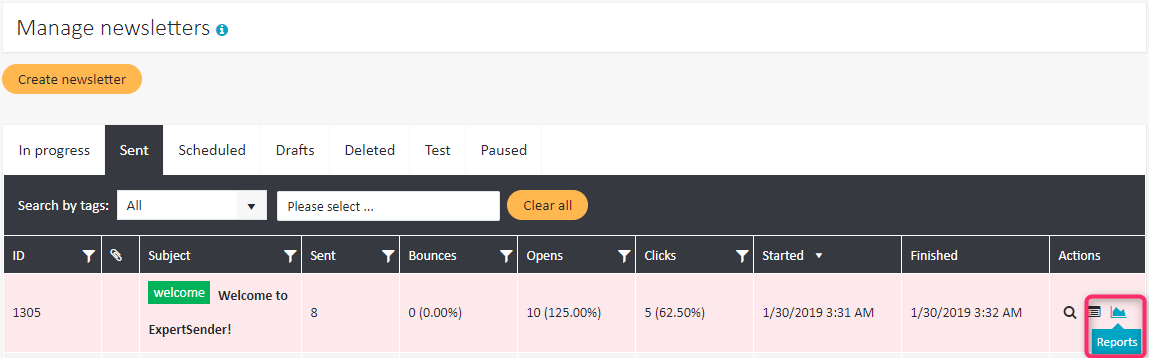
- Select Email Messages from the left-hand navigation and click the required message type, e.g. Newsletters.
- Select one of the message status tabs (In progress, Sent, Scheduled, Drafts, Deleted, Test, Paused).
- Click Reports next to a message you are interested in:

Detailed message reports#
Afterwards, the following view will be displayed:
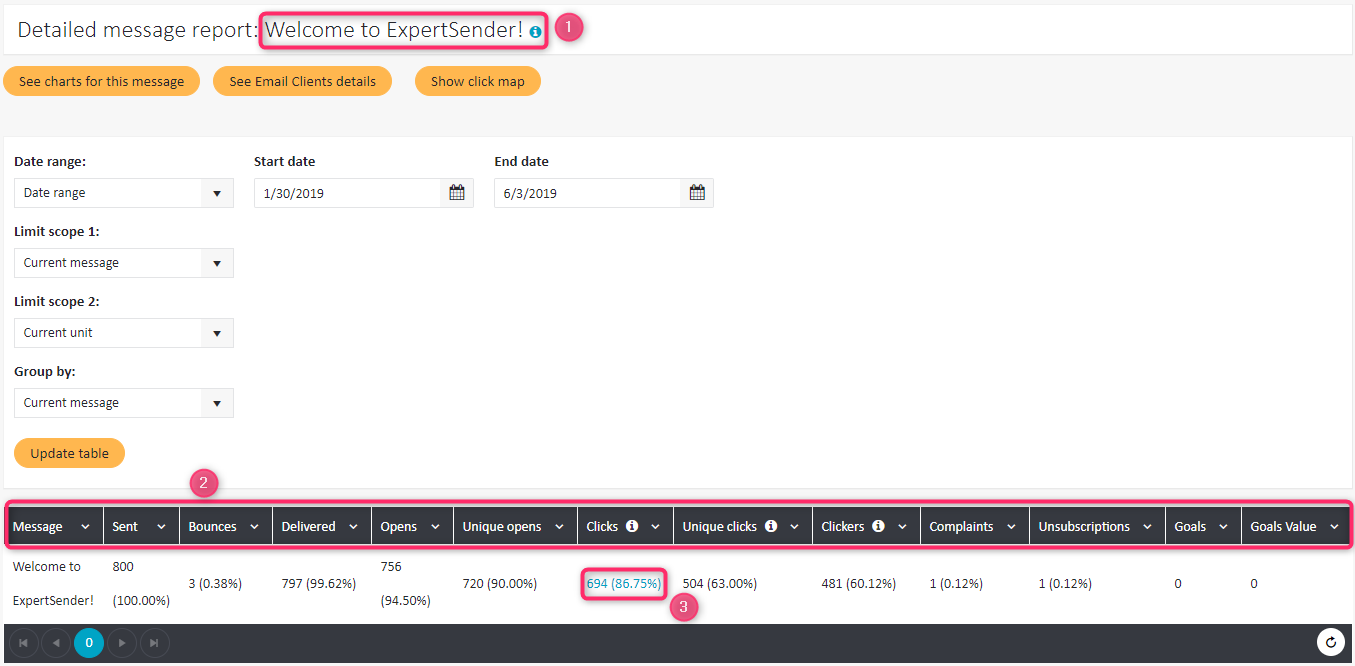
The header always contains the subject of the analyzed message (1). The report contains the following data (2):
- Sent – delivered + bounces
- Bounces
- Delivered
- Opens
- Unique opens
- Clicks – all clicks, including several clicks by one subscriber
- Unique clicks – number of first clicks on any link by any subscriber
- Clickers – number of unique subscribers who clicked on any link in any message
- Complaints – clicks on the Spam button
- Unsubscriptions
- Goals – the number of times the landing page was reached
- Goals value – the values with which the landing page was achieved
Opens vs. Unique opens#
If one subscriber opens the same email three times, it will appear in the statistics as three opens and one unique open.
Clicks vs. Unique clicks vs. Clickers#
If a user clicks five times on each of two given links, ten clicks will be counted, two unique clicks and one clicker.
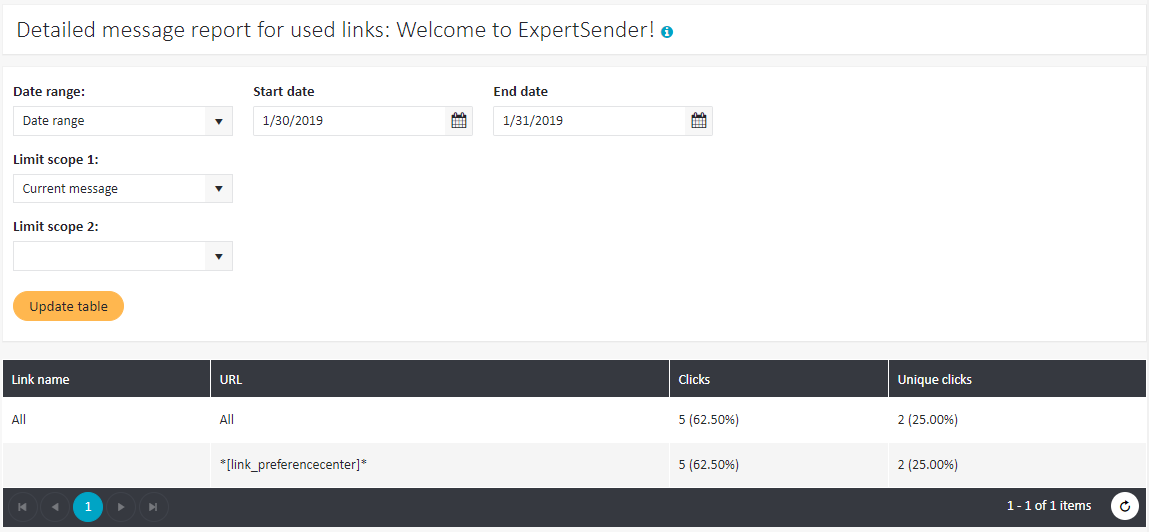
Note that, unlike in an Email summary report, you may click on the value under Clicks (see (3) above) to receive more detailed information on clicks in the message:
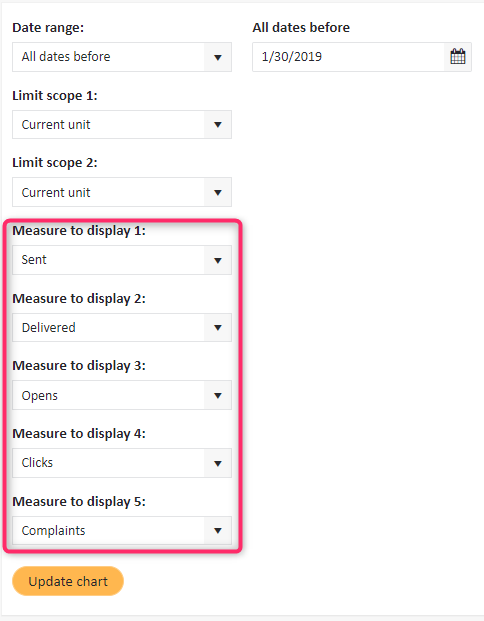
Statistics charts#
For each of the columns indicated in the report, you can see a graph showing the dynamics of this variable over the period of interest:

Up to 5 variables chosen from the list presented above can be displayed on the graph:
Email client details#
To access detailed statistics on the email clients used to open your message, click the See Email Clients details at the top. The following view will be displayed:
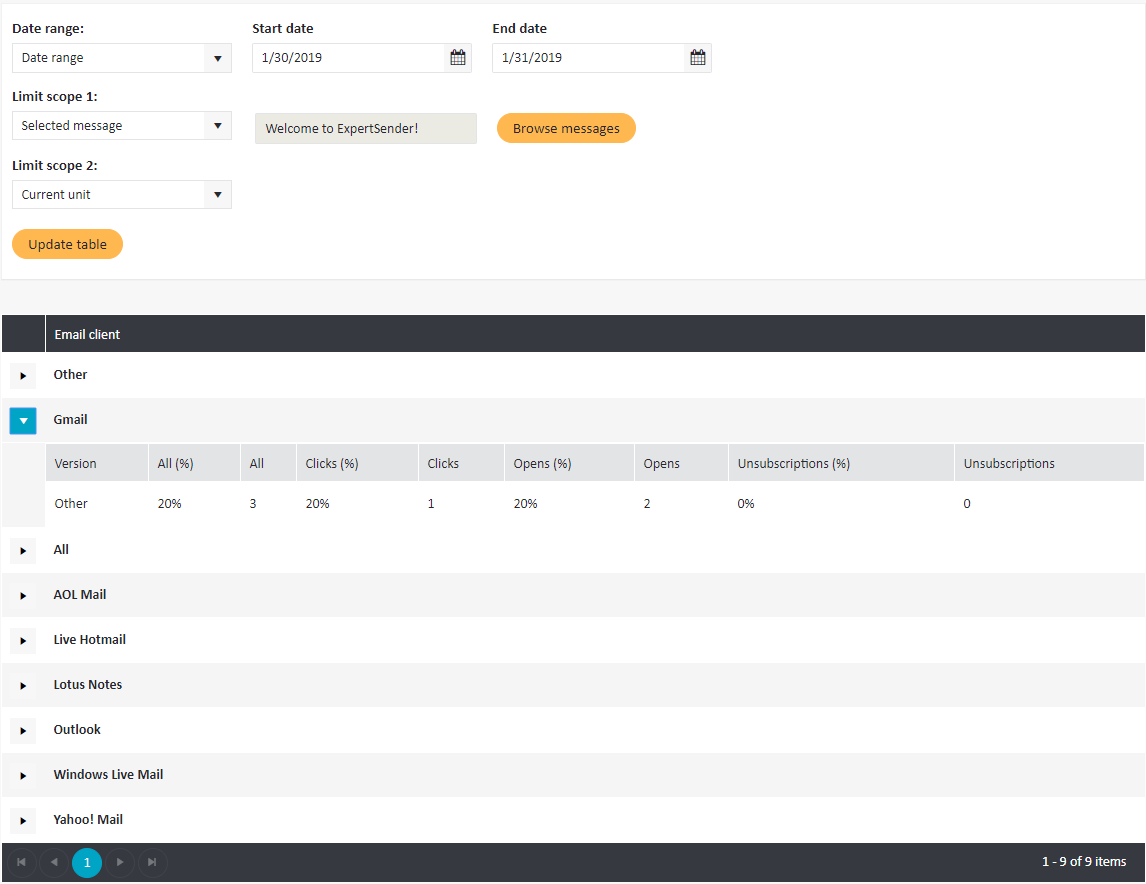
Click the arrow next to each client to display detailed data on its performance.
#
Click map#
To view a click map of a message, select the button Show click map at the top.
On the heat map of clicks that opens by default, the links most interesting to subscribers have labels of a warmer color, closer to red. Links that are clicked less often are marked with colder colors, closer to blue. At the bottom of the map, you can see what percentage of clicks are currently displayed, and also what percentage of the transitions are below the visible area.
When you hover the cursor over a link, a pop-up window appears with information on the number of unique and non-unique clicks, as well as the CTR and uCTR values.
In addition to the heat map, you can display a black-and-white click map, on which there will be no color highlighting of links (it is more suitable for presentations), as well as a map without overlays, showing information on a specific link when you hover over it.