Analiza RFM
Każdy pozyskany klient jest na wagę złota. Ale nie każdy klient w Twojej bazie jest tak samo cenny, zwłaszcza gdy różnie reaguje na Twoje działania marketingowe.
Warto śledzić potencjał klienta w tym zakresie i przekładać jego wartość na mierzalne wskaźniki. Do tego służy RFM, czyli model określania wartości klientów na podstawie trzech wymiarów:
- Recency – informuje ile czasu upłynęło od ostatniego zamówienia klienta w Twoim sklepie,
- Frequency – określa jak często klient składał zamówienie,
- Monetary – wskazuje ile pieniędzy wydał klient.
Analizę RFM klientów przeprowadzisz dopiero wtedy, gdy w platformie znajdą się dane zamówień złożonych w Twoim sklepie. Dane te mogą pochodzić z:
- informacji pozyskanych bezpośrednio z Twojej strony za pomocą naszego skryptu
- pliku z danymi, które możesz zaimportować w sekcji
Zamówienia > Zaimportuj dane zamówień
Używając modelu RFM w łatwy sposób przypiszesz statusy poszczególnym klientom, a na ich podstawie zbudujesz skuteczniejsze kampanie marketingowe i ciekawszą komunikację. RFM pomoże Ci także utrzymać Twoją bazę klientów w dobrej kondycji, wskazując nieaktywnych klientów.
Żeby skorzystać z funkcji RFM, musisz najpierw ustawić wartości dla każdego wymiaru. Jest to proste, choć wymaga namysłu i przede wszystkim dużej wiedzy o klientach.
Ustawienia modelu RFM
- Upewnij się, że masz poprawnie skonfigurowany kanał Web Tracking.
- W menu bocznym wybierz Ustawienia, następnie RFM i kliknij zakładkę Ustawienia Modelu.
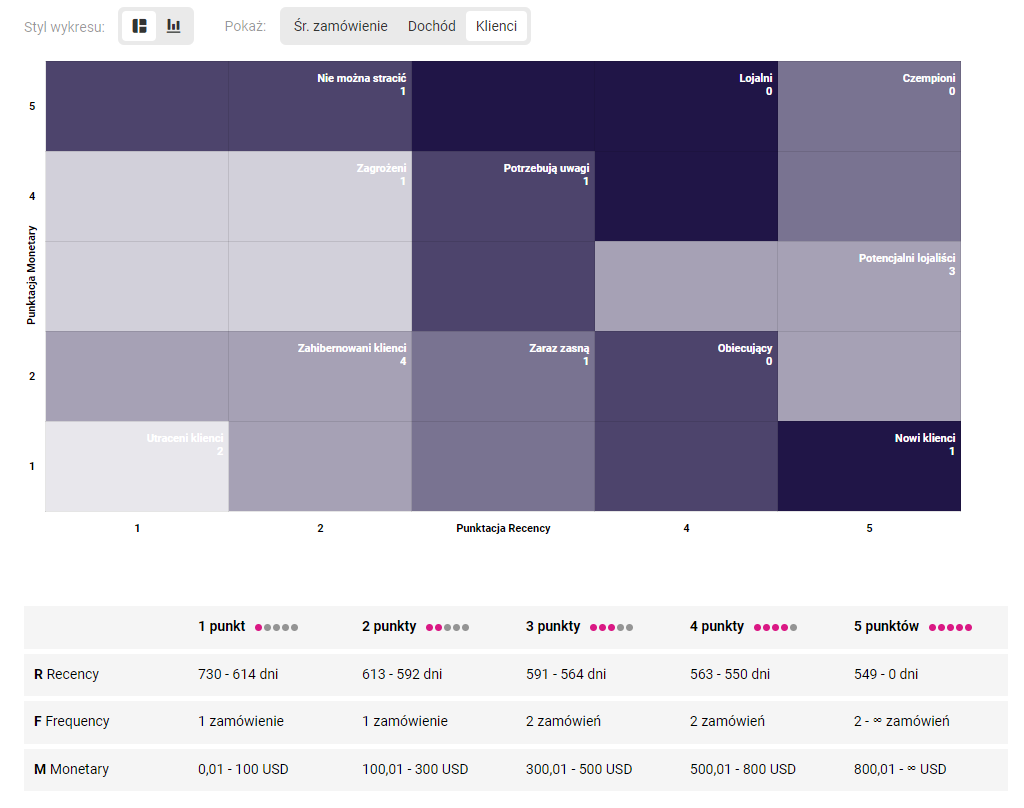
- W sekcji Ustawienia ogólne, w polu Rozmiar matrycy RFM wybierz interesujące Cię ustawienie. Domyślnie wybrany rozmiar matrycy to 5 × 5 × 5 pól. Matryca to wykres, który pokazuje wzorce zachowań klientów, a znajdziesz ją w sekcji Klienci > RFM.
- W następnym polu wybierz Przedział czasu, jaki ma uwzględniać analiza RFM. Masz do dyspozycji 5 przedziałów: 4 miesiące, 5 miesięcy, 6 miesięcy, 1 rok, 2 lata. Możesz ustawić tylko jeden przedział czasu dla analizy RFM.
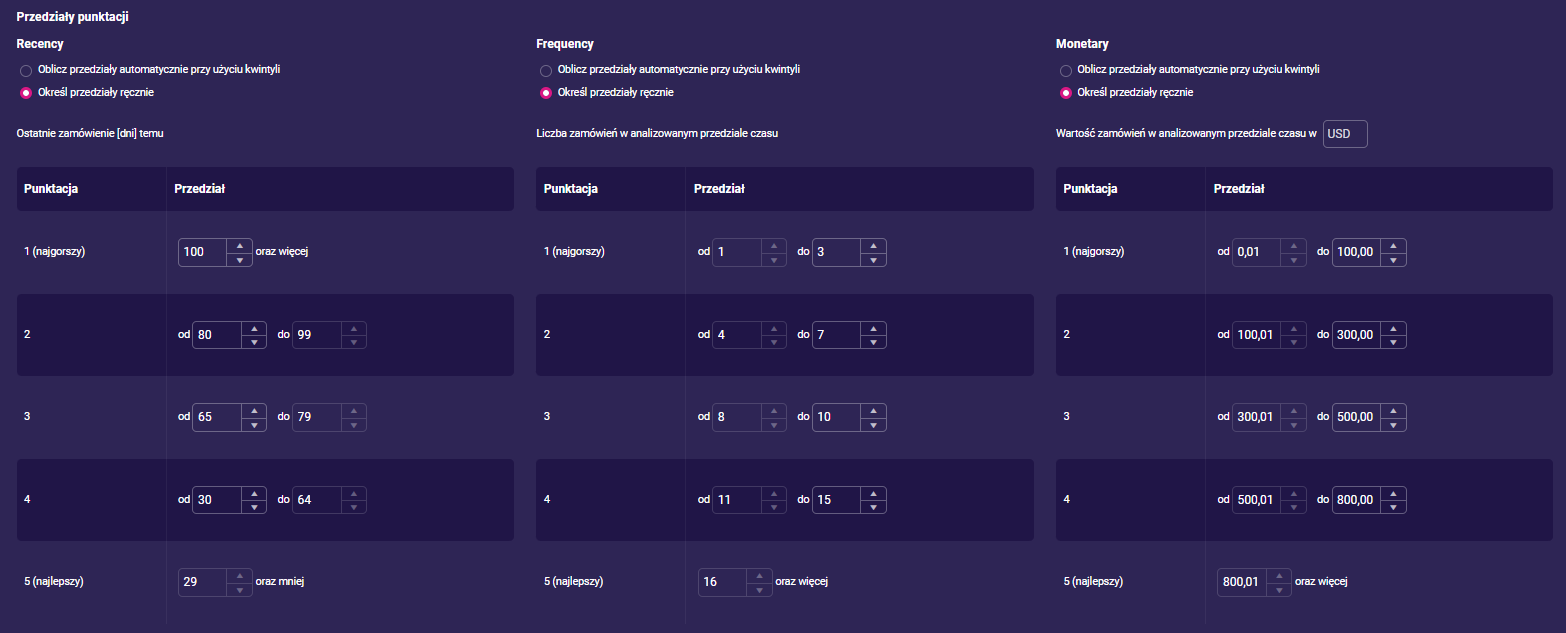
- Następnie w sekcji Przedziały punktacji wskaż, w jaki sposób chcesz określić przedziały punktacji. Punktacja to system oceny klientów w wymiarach recency, frequency i monetary. Wybierz jedną z dwóch opcji:
- Oblicz przedziały automatycznie przy użyciu kwintyli – opcja zaznaczona domyślnie; wybierz ją, jeśli pierwszy raz korzystasz z analizy RFM lub chcesz ją wypróbować. W tej opcji przedziały obliczone są metodą ilościową, na podstawie parametrów statystycznych.
- Określ przedziały ręcznie – w ramach każdego z przedziałów przyznaj klientowi punkty od 1 do 5 (1 = najgorszy, 5 = najlepszy). Jak to zrobić? Wskaż zakresy dla każdego z punktów. I tak:
- w wymiarze recency ustaw zakres na podstawie czasu, jaki minął od ostatniego zamówienia klienta, np. jeśli minęło 70 dni, klient otrzymuje 3 punkty.
- w wymiarze frequency ustaw zakres na podstawie liczby zamówień w wybranym wcześniej czasie, np. gdy klient zrealizował powyżej 16 zamówień w przeciągu 1 roku, otrzymuje 5 punktów.
- w wymiarze monetary ustaw zakres na podstawie wartości zamówień zrealizowanych w wybranym czasie, np. jeśli klient wydał 800 zł w przeciągu roku, otrzymuje 5 punktów. Kwoty podajemy w walucie deklarowanej podczas rejestracji konta w ExpertSender.
Ustal zakresy w taki sposób, aby odzwierciedlały rzeczywiste zdarzenia i zachowania klientów w Twoim sklepie, a nie sytuację idealną. Tylko wtedy analiza RFM będzie pożyteczna dla Twojego biznesu.

Segmenty RFM
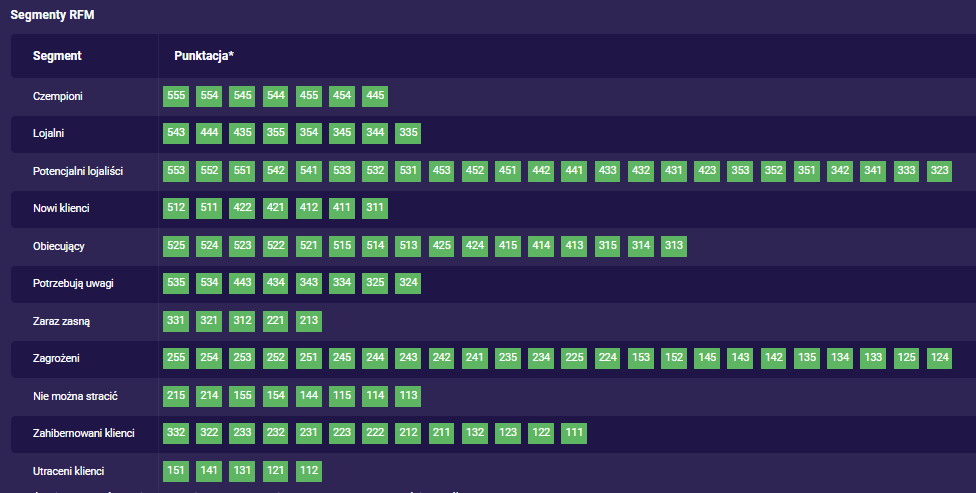
- Punktację odszyfrujesz w tabeli poniżej, w sekcji Segmenty RFM. W kolumnie Segment znajduje się 11 opisów dotyczących zachowań zakupowych klientów, np. czempioni, obiecujący, nie można stracić. W kolumnie Punktacja widzisz pola z zestawami wcześniej ustalonych przez Ciebie punktów.
Przykładowy klient opisany w punkcie 5. uzyskał punktację 355. Co ona oznacza?
Gdy odszukasz liczbę w tabeli dowiesz się, że klient został przypisany do segmentu Lojalni.

Jak odczytywać pola z punktami? Na przykładzie – do segmentu Czempioni przypisani są klienci, którzy otrzymali trzycyfrową punktację 454. Cyfry oznaczają kolejno wymiary recency, frequency, monetary:
- 4 = od ostatniego zakupu minęło 30 – 65 dni, a ocena dla tego progu czasowego to 4.
- 5 = zrealizowali powyżej 16 transakcji w danym czasie, a ocena dla tego progu to 5.
- 4 = wydali między 500,01 a 800 zł na zakupy w danym czasie, a ocena dla tego progu to 4.
Dzięki analizie RFM zaprojektujesz lepszą komunikację dla każdego z segmentów, np. wysyłając kod rabatowy dla klientów potrzebujących uwagi lub dając wcześniejszy dostęp do wyprzedaży czempionom.
- Jeśli chcesz zmienić punktację dla danego segmentu, wprowadź zmiany ręcznie lub przeciągnij kafelek z punktacją do innego segmentu metodą ‘przeciągnij i upuść’.
- Pod tabelą znajdziesz przycisk Przywróć domyślne punktacje, który resetuje wprowadzone przez Ciebie ustawienia jednym kliknięciem.
- Po wprowadzeniu punktacji kliknij Zapisz, aby zachować wszystkie ustawienia.
Wyniki analizy RFM – jak je odczytywać?
Po ustawieniu modelu RFM wróć do menu bocznego, wybierz sekcje Klienci i podsekcję RFM. Tutaj znajdziesz wyniki ostatniego przeliczenia modelu RFM dla segmentów klientów:
- Czempioni
- Lojalni
- Potencjalni lojaliści
- Nowi klienci
- Obiecujący
- Potrzebują uwagi
- Zaraz zasną
- Zagrożeni
- Nie można stracić
- Zahibernowani klienci
- Utraceni klienci
Panel RFM podzielony jest na dwie części. Po lewej znajdziesz wyniki w formie wykresu. Rodzaj wykresu wybierasz za pomocą suwaka znajdującego się nad polem wykresu, po lewej stronie:
- Matryca – wykres o wymiarach 5 × 5 × 5 pól przedstawia rozkład każdego z segmentów według osi recency (poziomo) i monetary (pionowo) i dodatkowej zmiennej: średnia wartość zamówień, dochód, klienci.

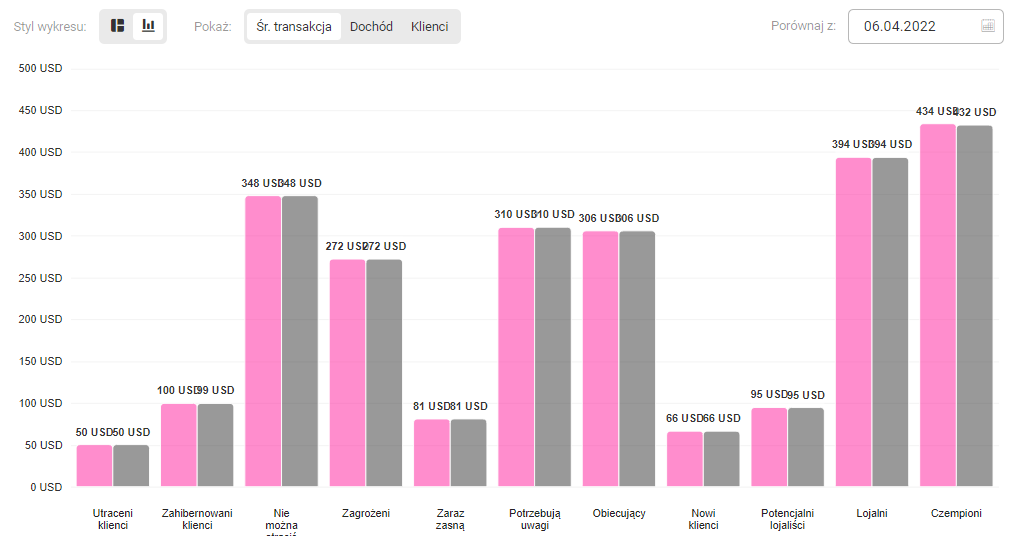
- Wykres słupkowy – pokazuje wielkość poszczególnych segmentów klientów (oś pozioma) w zależności od średniej wartości zamówienia, dochodu i liczby klientów (oś pionowa). Bieżące dane na wykresie możesz porównać z wynikami z innego okresu wybierając datę z kalendarza umieszczonego nad wykresem po prawej stronie.

Zmienne dla matrycy i wykresu słupkowego ustawisz za pomocą suwaka znajdującego się nad wykresami.
Dane na wykresie i matrycy uzupełnia tabela znajdująca się pod nimi. Tam znajdziesz szczegóły dotyczące segmentów. W wierszach umieszczone są wskaźniki RFM, w kolumnach punktacja wprowadzona przez Ciebie w ustawieniach modelu RFM.
Gdy klikniesz dowolny segment na macierzy lub na wykresie, w prawej części strony wyświetlą się szczegóły wybranego segmentu: liczba klientów znajdujących się w segmencie, średnia wartość zamówienia oraz wielkość dochodu.
Dodatkowo przy każdej wartości znajdziesz informację o procentowym udziale wyników w porównaniu do poprzedniego miesiąca, wraz z zaznaczeniem trendu – wzrostowego (zielona strzałka) i spadkowego (czerwona strzałka).
Segmenty możesz zmieniać korzystając z rozwijanej listy znajdującej się nad szczegółami segmentu.
Obok rozwijanej listy znajdziesz przycisk Stwórz segment, dzięki któremu szybko ‘wyeksportujesz’ wybrany segment i stworzysz z niego grupę odbiorców np. kampanii reklamowej lub scenariusza. Tworzona z tego miejsca grupa automatycznie uzupełni się o dane eksportowanego segmentu.