Email newsletters
In this article, you will learn how to create an email message from scratch, plan email delivery to your targeted audience and track their responses and reactions to your content.
Let’s start with the statistics.
Email – statuses and marketing metrics
You can find information about the statuses and performance of all created emails in the table located in the Campaigns > Email section. This allows you to monitor the results of each message and better tailor your sales strategy:
- All – displays all emails created in the platform, regardless of their statuses, except for email messages used in scenarios.
- In progress – displays all email messages being sent at this moment. This includes scheduled messages and messages sent immediately. Scheduled messages are sent by throttling, so they can be delivered in an automatic or defined time span.
- Draft – includes emails that are under construction.
- Scheduled – contains a list of emails scheduled for delivery. They can’t be edited, but you can change their status to Draft by clicking the Pause icon.
- Sent – contains all messages sent to the recipients. They cannot be edited or deleted.
- Paused – displays messages paused for any reason, such as a typo or faulty linking. You can only edit the content of a paused message; the rest of the settings cannot be changed.
- Deleted – here, you will find all discarded emails, with an option to restore them.
- Tests – trial messages you sent before launching an email campaign.
Marketing metrics are provided in whole numbers and percentages to facilitate the interpretation of campaign results:
- Sent – the number of messages sent to recipients.
- Opened:
- The number of opened messages.
- The open rate, which is the percentage of delivered messages that were opened for the first time. Formula: Open Rate = (opened / delivered) x 100%
- Clicked:
- The number of messages with at least one click. It also represents the number of recipients who clicked the message at least once.
- The click-through rate, which is the percentage of delivered messages with at least one link click. Formula: Click-Through Rate = (clicked / delivered) x 100%
- CTOR (Click-to-Open Rate) – the percentage of any link clicks in the message compared to the total number of opens for that message. Formula: CTOR = (clicks / opens) x 100%.
- Bounced:
- The number of undelivered messages due to a permanent or temporary delivery issue.
- The bounce rate, which is the percentage of sent messages that were not delivered to recipients and returned to the sender. Formula: Bounce Rate = (bounces / sent) x 100%
- Unsubscribed:
- The number of recipients who have opted out of receiving your messages.
- The unsubscribe rate, which is the percentage of delivered messages from which recipients unsubscribed. Formula: Unsubscribe Rate = (unsubscribes / delivered) x 100%.
There is a quick search option above each grid table. It enables filtering messages by their statuses, email addresses, subjects, segments, and others. You can use multiple filters at once.
Also, all data presented in the grid tables can be sorted by columns in both descending and ascending order. Click the column header to enable sorting. An arrow will appear that indicates the sorting direction.
Use the page browsing tool located under the table to access all email statistics. To adjust the number of rows displayed in the table, use a row picker with fixed values: 10, 20, 50, 100.
Create email newsletter
Open the main menu and go to Campaigns > Email. Click Create email button to open the email editor.
It takes five steps to design and set an email message in this editor. The step you are currently in, is underlined. You can switch between the steps during your work, it will be saved upon every change of step.
While reviewing your email in the Summary, some steps may be marked with a dot to inform you, that some information is missing or need to be changed.
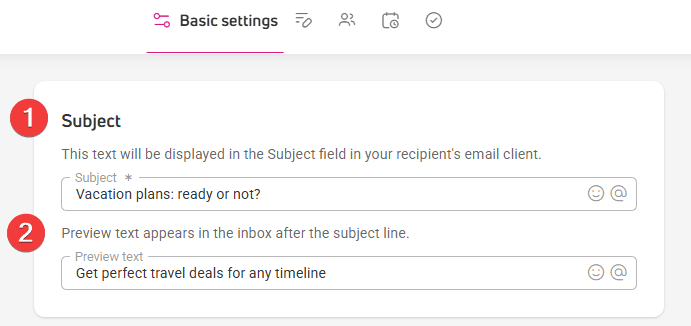
Step 1: Basic settings
In this step, you will add an email subject and preheader text, handle sender and reply-to addresses, and set up email tracking methods.
- Enter the email subject in the Subject field. You can customize with dynamic content available at @ icon. You can also add emojis here.
- In the Preview text field, enter the additional message that will display under the subject in an email box. You can personalize this field with dynamic content and emojis as well.

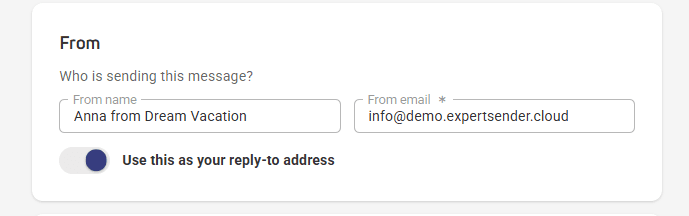
- In the From field, enter the name that will display in your customers’ email box, e.g., “Ann from onlinestore.com.” Enter your email address in the next field and toggle Use it as your reply-to address, if you want your customers to be able to contact you by hitting the reply button.

- In the Tracking section, you will enable email clicks and opens tracking. To measure website traffic that comes from the newsletter campaign, you can add metrics and parameters to track website traffic that comes from your newsletters:
- Google Analytics – here, you can add UTM tags that will help you identify the message as a source of traffic to your website. The tags recognized by GA4 are source, medium, content, campaign, and term.
- Custom parameters – enter additional or unique parameters here, if you use them in you email campaigns. Dynamic content tags can also be very useful here.


Step 2: Content
An intuitive drag-and-drop graphic editor is used to design the content and appearance of emails. You can design your message from scratch or use the extensive template library.
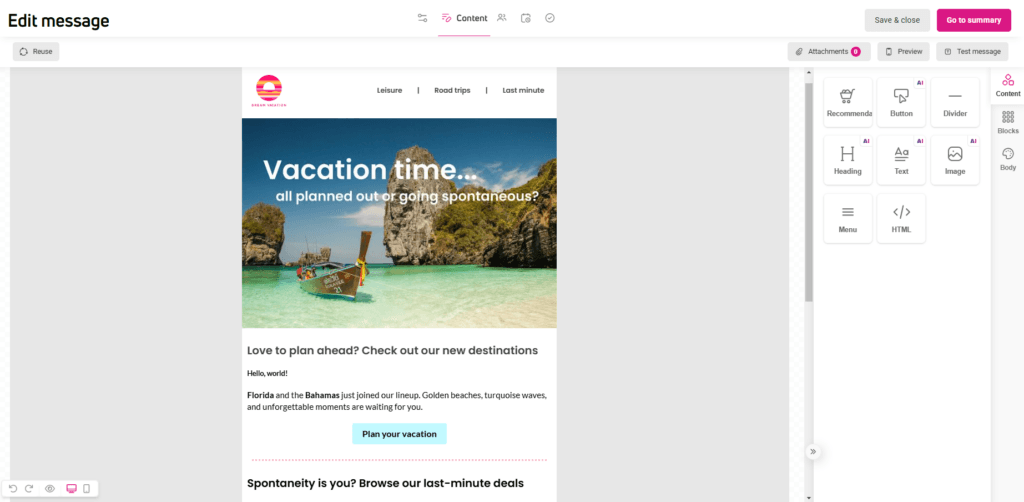
A detailed description of all editor functions can be found here: How does the message editor work.
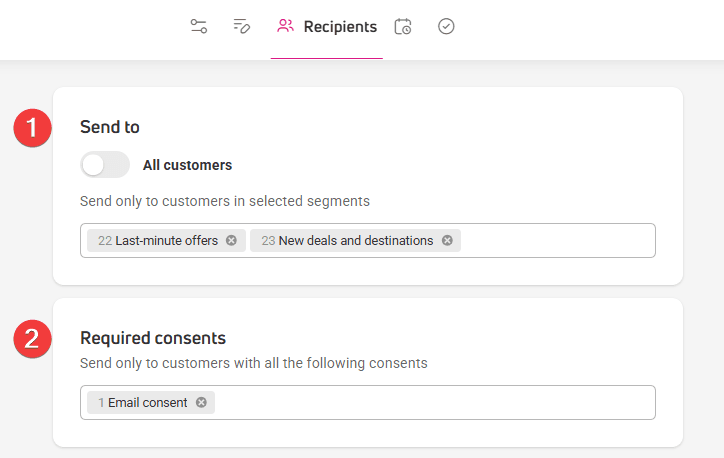
Step 3: Recipients
In this step, you will choose the audience for your email content:
- In the Sent to section, select All customers if you plan to reach all your customer database with the designed email. To narrow your recipients’ pool, click the Select segment input to access a dropdown list with customer segments you have prepared beforehand. There is also an option to craft such a segment by clicking Create new.
- In Required consent section, select one or multiple consents from the dropdown list. If you select multiple consents, the email will be sent only to customers that have granted all of them. In case you need to promptly add a consent, use the Create new option available from the dropdown list.

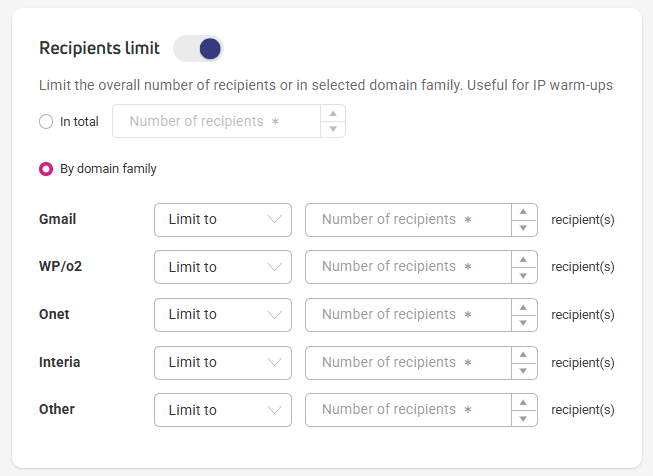
- In Recipients limit section, you can limit the general number of recipients or per domain family used for email delivery. This option is useful for IP warm-up process, which are a standard procedure when you are a beginner in email marketing.

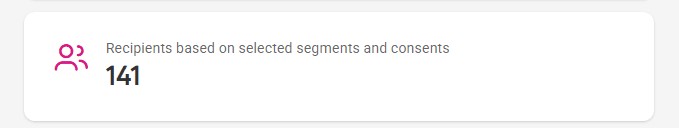
- Once you have set your audience limit, an exact number of recipients that meet the applied requirements will be displayed in a section below. Every time you change the recipient settings, we will recalculate the final number of customers that will receive your email.

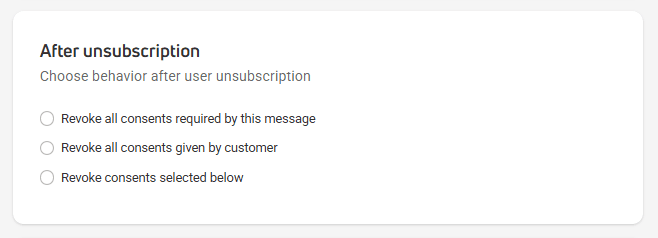
- In the After subscription section, decide what will happen with the customer consents once they click the unsubscribe link.

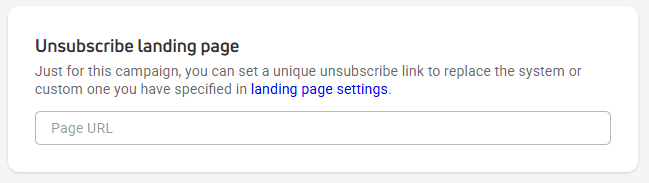
- In the Unsubscribe landing page you can paste an URL link to a unsubscribe page customized for a newsletter campaign you are currently working on. If you prefer to use your standard unsubscribe page or need a temporary system page for this purpose, read how to set them in Settings > Landing pages.

Step 4: Delivery
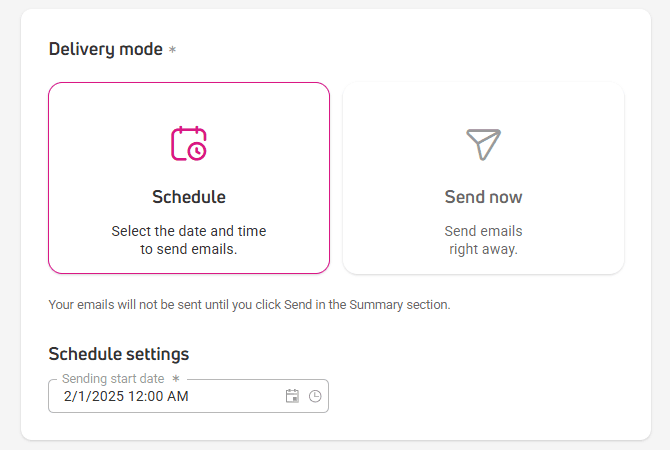
Choose the delivery mode:
- Click the Schedule mode to set a specific delivery time and date.
- If you want your email to be sent right away, opt for the Send now mode. The delivery will start after you click Send in the Summary section.

In the Advanced settings section, you will decide on IP channels and method.
There are two IP channels you can use for sending emails via ECDP platform:
- Standard – the emails will be distributed automatically,
- Custom – the emails will be distributed through all the IP addresses assigned to your account. Decide on the distribution by setting the number of messages for each domain.

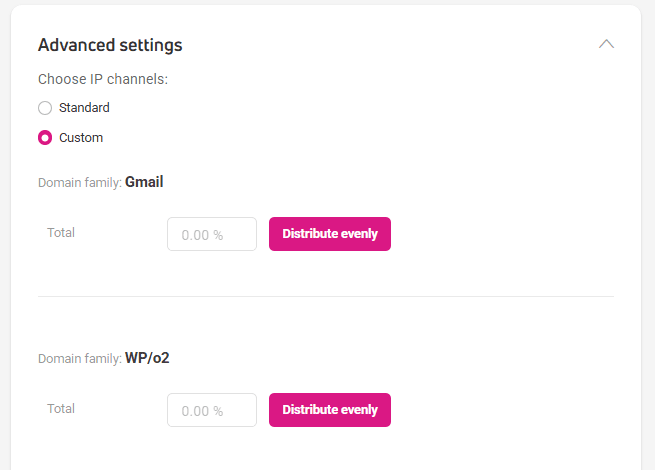
We recommend the Custom option if you are using both new and warmed-up IP addresses. This way you can direct more traffic through addresses that have been in use for some time and have good reputation, and load the new IPs with less traffic to let them earn their reputation.
Such strategy will positively affect deliverability and build your IPs credibility.
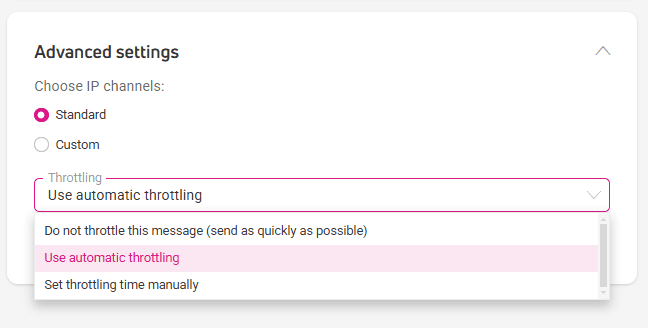
In the Throttling section, decide how your message should be set in terms of time:
- Do not throttle this message – we will send your email as quickly as possible to all the recipients. Don’t choose this option if your IP addresses are in the warmup process, as it may impact both the deliverability ad credibility badly.
- Use automatic throttling – we will spread the delivery in time in a way that ensures the best deliverability possible.
- Set throttling time manually – set how long should we spread the deliverability in time. The upper time limit is 72 hours.

Finally, toggle on the last option if the delivery should ignore the local blocklist of email addresses.
Step 5: Summary
This is the final stage of creating emails. Here you’ll check how your message will look on the computer and mobile device screens. Click the Desktop and Mobile icons to switch between views.
On the left side, you’ll find a checklist with elements necessary to send an email:
- Elements entered correctly are highlighted in green.
- Elements requiring improvement are in red. You can fix them by clicking the pencil icon.
- Orange marking is added to elements that could work better, but improvements aren’t necessary for sending the message to the recipients.
- Blue is usually additional, marketing information that can add value to your content.
At this stage, you can save the created email for later or launch it:
- Save and close – this button will save the message as a draft and take you to the email list in the control panel.
- Send – clicking this button will start the message delivery.
Email message report
To access a report for a chosen email message, search for this message in the grid table and click the Reports icon.
In a new window, you will find a set of email metrics.
In the top panel, you will find the email subject and date range for which the data is displayed. You can also preview the email creation by clicking the Preview message button.
Below the panel, you will find three mail email metrics:
- Revenue generated by this email message,
- Unique open rate against total open rate – shows how many messages counted unique opens against all opens, including repetitive opens of the same message.
- Unique click rate against total click rate – shows how many messages counted unique clicks against all click, including multiple clicks of the same message.
The next set of five metrics reports on:
- Sent – the total number of email addresses to which the email was sent.
- Delivered – the rate of successfully delivered email out of the total messages sent.
- Click to Open Rate – the rate of clicked emails out of the total opened emails.
- Bounced – the rate of bounced emails out of the total emails sent.
- Unsubscribed – the rate of unsubscribed emails out of the total delivered emails.
No report can do without charts, as visual representation of data speaks louder than a table filled with digits.
The chart on the left represents the recipient’s reaction to an email within a given timespan.
The chart on the right represents a timeline of email message delivery along with recipients behavior.
You can easily spot the recipients’ peak interest in your message. Switch between the Opened and Clicked view using a switch located above the chart.
In ECDP, you will also find an email summary report that allows you to analyze your activities in the context of multiple campaigns. You will find it under Reports > Email.