Which metrics do you need for ECDP subscription pricing and product recommendations?
Before we price your ExpertSender CDP and product recommendations costs, we need some basic data about your website traffic and customer base. In this article, we explain which marketing metrics we’re talking about, what they mean exactly, and where to find them in Google Analytics 4.
ExpertSender CDP
Monthly ECDP platform cost depends on two things:
- Number of customers with at least one marketing consent – these are people who agreed to receive emails or SMS messages. Your full database might be larger – we only count those with active consent.
- Engaged sessions – these are visits to your website that, under the Google Analytics 4 definition, meet at least one of these conditions:
- last longer than 10 seconds,
- have a key event,
- include 2 or more page or screen views.
Why do these numbers change? Your marketing activities affect the number of customers and sessions each month. That’s why we bill based on the highest value in a given month – we record data daily to keep everything transparent.
Keep in mind that data from GA4 is indicative. We use it for pricing, but billing is based on data collected by the ECDP tracking script. ECDP counts sessions by its own rules, so values in ECDP can differ from those in GA4. For details and a comparison of the definitions, see Why data in ECDP and Google Analytics 4 may differ.
Product recommendations
The recommendation system cost depends on traffic and customer engagement in your store. More interactions mean higher cost, but also better recommendation quality. And better recommendations mean more orders.
We bill recommendations based on two things:
- Number of active users – these are people who visit your website. We count website users, not the contacts in your email marketing database.
- Number of requests – these are queries to the recommendation engine for the products to display. Requests occur when recommendations appear on your website or in the emails you send.
We match both values to packages, as in the price list. The higher of the two packages sets the price.
For pricing, we need two metrics:
- Page views – how often customers browse products. We use them to estimate the number of requests.
- Active users – how many people regularly visit your store.
For recommendations alone, these two metrics are enough. Engaged sessions are needed only to price the ECDP platform.
Where to find this data in Google Analytics 4
Instead of searching for information in different places, create one exploration with all the data you need.
Note: creating an exploration in GA4 may require higher permissions. If you can’t complete any of the steps below, ask someone with higher permissions in your GA4 property to do it for you.
- Log into GA4 and select the right account.
- In the left menu, click Explore, then Blank.
- In the Variables column, set the date range to the last full months, ideally 6:
- Start on the first day of the oldest month and end on the last day of the last full month. Don’t include the current, incomplete month.
- If GA4 doesn’t let you select 6 months, choose the longest range available. The available range depends on the settings of your GA4 property. The minimum is 1 full month.
- Several months let us check whether traffic in any of them was unusually high.
- Next to Dimensions, click +, search for Month, select it, and click Import.
- Next to Metrics, click +, then search for and select three metrics:
- Active users,
- Views,
- Engaged sessions.
Click Import.
- In the Settings column, drag Month to Rows and the three metrics to Values.
- Take a screenshot of the table and send it to our sales team.
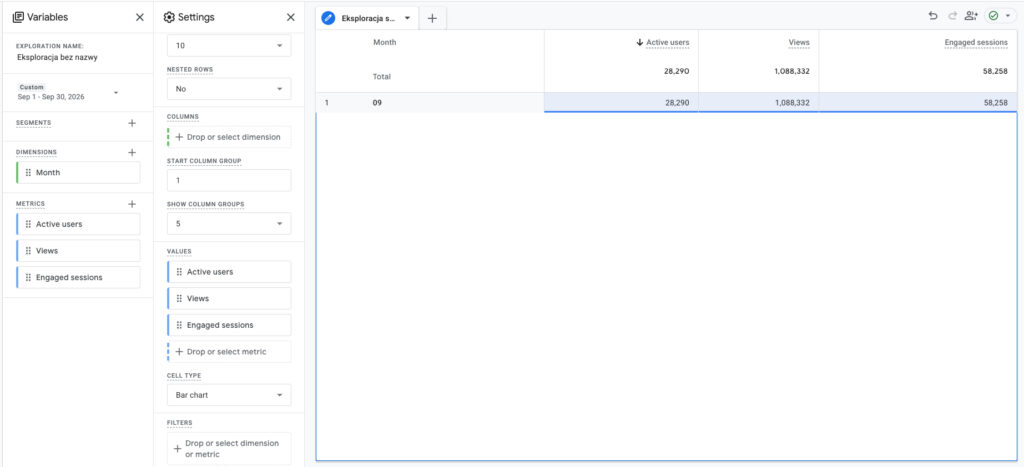
Helpful tip: the table shows the month as a number, for example 09 stands for September.